

Most projects that are "about two months" from done don't finish in two months. The problem usually isn't a slow team; it's the lack of a plan. The work was never broken down, durations were written with hope rather than estimation, and nobody worked out which task waits for which. In this guide we answer how to create a project plan step by step, using a single example project all the way from scope to Gantt chart and plan tracking.
We built the guide like a short course: seven lessons, each explaining one concept, applying it to the same example project and ending with an exercise for your own. At the end you'll find a plan template, common mistakes and a one-week programme for your first plan.
What Is a Project Plan?
A project plan is the roadmap that brings a project's goal, scope, tasks, task durations and sequence, owners, milestones and tracking method together in one document. It answers the "what", "who", "when" and "how will we track it" questions of a project.
How Should You Use This Guide?
Follow the lessons in order. Every example plans the same project: the first release of a dealer portal where a manufacturer's dealers order online. Durations are in illustrative working days.
| Lesson | Topic | What you will be able to do |
|---|---|---|
| 1 | Goal and scope | Write on one page what the project covers and what it doesn't |
| 2 | Work breakdown structure | Split the project into manageable work packages |
| 3 | Duration estimates | Give realistic durations with the PERT method |
| 4 | Dependencies | Work out which task waits for which |
| 5 | Critical path | Find the end date and the tasks that cannot slip |
| 6 | Gantt chart and milestones | Turn the plan into a schedule everyone can read |
| 7 | Resource plan and tracking | Balance who works when and measure variance |
Recommended reading: Our project management software service
Lesson 1: How Do You Write the Project Goal and Scope?
Every plan starts with a one-page project definition that states why the project exists, what it will deliver and what it won't. A project with a vague scope has a vague duration too, because every new request is quietly added to the schedule.
| Heading | In the example project |
|---|---|
| Goal | Move dealer orders that arrive by phone and email online |
| Deliverables | Dealer login, ordering by product code and from lists, dealer-specific prices, order history, order transfer to the ERP |
| Out of scope | Mobile app, online payment, promotions module (later releases) |
| Success criterion | Dealer orders start arriving through the portal and are no longer typed into the ERP by hand |
| Constraints | Must work with the existing ERP; dealer prices must come from the ERP |
| Sponsor and team | Sales manager (decision maker), project manager, designer, two developers, tester |
The "out of scope" row matters most: every later "can we also add…" request is assessed against it, and either goes into a later release or triggers a recalculation of plan, duration and budget.
Recommended reading: How to do software requirements analysis: the way to a clear scope
Lesson 2: How Do You Build a Work Breakdown Structure (WBS)?
A work breakdown structure (WBS) is a hierarchical list that breaks a project's deliverables down, level by level, into manageable work packages. A work package should be small enough to give to a single owner, to estimate and to see clearly when it's finished.
Start the breakdown from deliverables, not activities. "Coding" is not a deliverable; "the order screen" is. Here are the work packages for our example project:
| Code | Work package | Deliverable | Owner |
|---|---|---|---|
| A | Requirements analysis | Approved requirements document | Project manager |
| B | UI design | Approved screen designs | Designer |
| C | Database and API | Working order, product and dealer services | Developer 1 |
| D | Front-end development | Dealer login, ordering and history screens | Developer 2 |
| E | ERP integration | Prices and stock from the ERP, orders into the ERP | Developer 1 |
| F | Testing | A release with bugs fixed that has passed acceptance testing | Tester |
| G | Training and launch | Trained dealers, live portal | Project manager |
If a work package runs longer than a few weeks, break it down one more level.
Lesson 3: How Do You Estimate Task Durations?
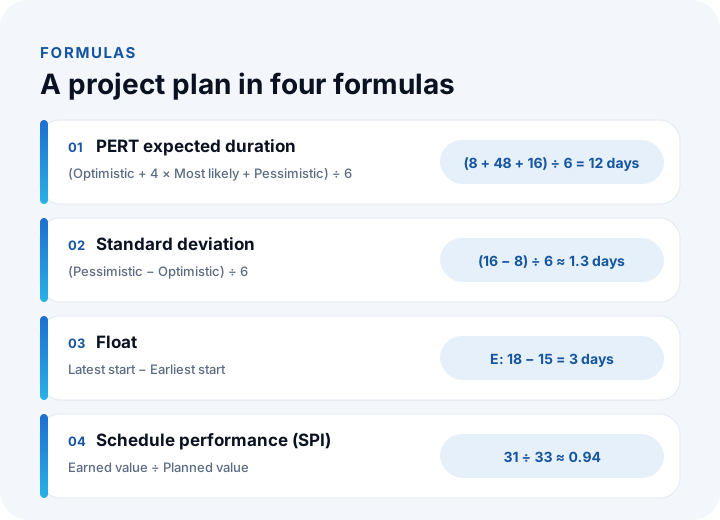
A single-number estimate is usually optimistic. The PERT method asks for three estimates per task and combines them with a weighted average: Expected duration = (Optimistic + 4 × Most likely + Pessimistic) ÷ 6.
For front-end development (D) in our example, we ask the developer three questions: if everything goes well, how many days will it take? What is the most likely duration? If problems come up, how long could it take in the worst case? Say the answers are 8, 12 and 16 days.
Expected duration = (8 + 4 × 12 + 16) ÷ 6 = 72 ÷ 6 = 12 days
The standard deviation shows how large the uncertainty is: (Pessimistic − Optimistic) ÷ 6 = (16 − 8) ÷ 6 ≈ 1.3 days. Tasks with a large standard deviation carry the most schedule risk and should be watched closely. Applying the same calculation to the other tasks gives: A 5, B 8, C 10, D 12, E 9, F 6 and G 3 working days.
Estimate durations with the person who will do the work, and reflect holidays, leave and their other commitments in the schedule.
Lesson 4: How Do You Identify Dependencies Between Tasks?
A dependency means a task has to wait on the state of another task before it can start or finish. The most common type is "finish-to-start": the next task can't start until the previous one finishes. For every work package, ask: "Which task has to be finished before this one can start?"
| Dependency type | Meaning | Example |
|---|---|---|
| Finish-to-start (FS) | B can't start until A finishes | Design doesn't start until requirements are approved |
| Start-to-start (SS) | B can't start until A starts | Writing test cases starts when development starts |
| Finish-to-finish (FF) | B can't finish until A finishes | The user guide can't be finished until the screens are |
| Start-to-finish (SF) | B can't finish until A starts | The old system isn't switched off until the new one goes live |
In our example all dependencies are finish-to-start: B and C wait for A; D waits for both B and C; E waits only for C; F starts when D and E are finished; and G follows F.
Lesson 5: How Do You Calculate the Critical Path?
The critical path is the chain of tasks running from the start to the end of the project with the longest total duration. If any task on that chain slips by a day, the whole project slips by a day. You find it in two passes: a forward pass calculates each task's earliest start and finish, and a backward pass calculates its latest start and finish.
Forward pass: A task with no predecessors starts on day 0. Earliest finish = Earliest start + Duration. If a task waits for several tasks, its earliest start is the latest of their finishes.
Backward pass: The last task's latest finish is the project end day. Latest start = Latest finish − Duration. If several tasks follow a task, its latest finish is the earliest of their latest starts.
Float (slack) = Latest start − Earliest start. Tasks with zero float are on the critical path.
| Task | Duration | Predecessors | Earliest start–finish | Latest start–finish | Float |
|---|---|---|---|---|---|
| A Requirements | 5 | - | 0–5 | 0–5 | 0 |
| B Design | 8 | A | 5–13 | 7–15 | 2 |
| C Database and API | 10 | A | 5–15 | 5–15 | 0 |
| D Front end | 12 | B, C | 15–27 | 15–27 | 0 |
| E ERP integration | 9 | C | 15–24 | 18–27 | 3 |
| F Testing | 6 | D, E | 27–33 | 27–33 | 0 |
| G Training and launch | 3 | F | 33–36 | 33–36 | 0 |
The critical path is A → C → D → F → G, with a total duration of 5 + 10 + 12 + 6 + 3 = 36 working days, roughly seven and a half weeks on a five-day week. Design (B) has 2 days of float and ERP integration (E) has 3: those tasks can slip that much without delaying the project.
So if you want to finish sooner, add resources to the API and front end, not to design: speeding up a task off the critical path doesn't change the end date.
Lesson 6: How Do You Build a Gantt Chart and Set Milestones?
A Gantt chart is a plan view that shows each task as a bar on a calendar, from its start to its finish. Tasks run down the rows and time runs across the columns; dependencies are shown with arrows and milestones with diamonds. Tasks on the critical path are highlighted in a different color.
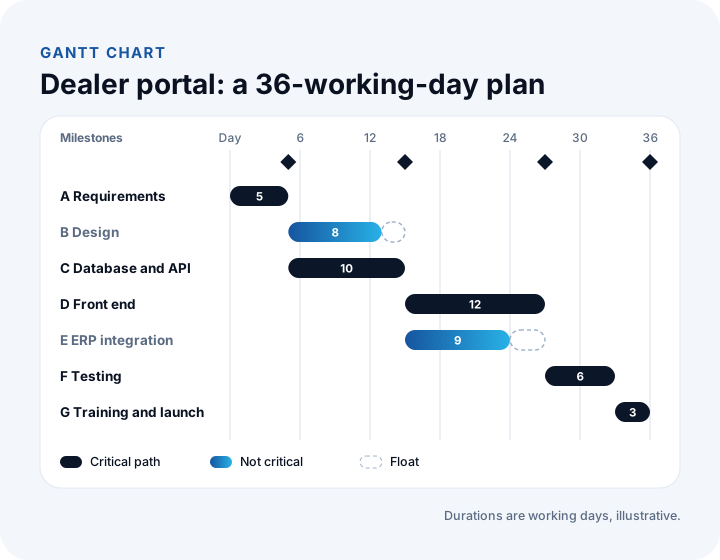
A milestone is an event with no duration that marks an important point in the project. Milestones are usually tied to an approval, so the plan shows a schedule of decisions as well as of work. The milestones of our example project are:
| Milestone | Day | Approved by |
|---|---|---|
| Requirements approved | 5 | Sponsor |
| Design and API ready | 15 | Project manager |
| Acceptance testing started | 27 | Tester |
| Portal live | 36 | Sponsor |
Prepare two views: a detailed one for the team with every task and dependency, and a simple one for management with only the main packages and milestones.
Lesson 7: How Do You Plan Resources and Track the Plan?
A resource plan shows which person works on which task on which days and prevents giving one person two tasks at the same time. Tracking compares actuals with the plan, and the most practical measure is the schedule performance index: SPI = Earned value ÷ Planned value.
How do you resolve a resource conflict?
In our example, developer 1 owns both C (days 5–15) and E (days 15–24). They run back to back, so there's no conflict; if C slips a day, E's 3 days of float absorb it. Float is the most valuable buffer in resource planning: non-critical tasks can be shifted within it to balance workload.
How do you track the plan?
For tracking, think of each task's effort in working days. The project's total effort is 5 + 8 + 10 + 12 + 9 + 6 + 3 = 53 working days. By the end of day 20, the plan says A, B and C should be finished and 5 days each of D and E should be done: Planned value = 5 + 8 + 10 + 5 + 5 = 33. In reality only 3 days of front-end work are complete instead of 5: Earned value = 5 + 8 + 10 + 3 + 5 = 31.
SPI = 31 ÷ 33 ≈ 0.94
An SPI below 1 means the project is behind: here about 94% of the planned work is done. The delay is on the critical path, so it needs action: extra resources, deferring part of the scope or a new end date. A delay in a task with float wouldn't move the schedule until the float ran out.
What Should a Project Plan Include?
A good project plan brings the outputs of all seven lessons together in one document. You can use the template below for your own projects:
| Section | Content | From lesson |
|---|---|---|
| Project definition | Goal, deliverables, out of scope, success criterion, constraints | Lesson 1 |
| Work breakdown structure | Work packages, deliverables and owners | Lesson 2 |
| Durations and risk | Expected duration and standard deviation per task, risk list | Lesson 3 |
| Network and critical path | Dependencies, earliest and latest dates, float | Lessons 4–5 |
| Schedule | Gantt chart and milestones | Lesson 6 |
| Resource plan | Workload per person and leave calendar | Lesson 7 |
| Communication and tracking | Weekly status meeting, report format, change request process | Lesson 7 |
What Are the Most Common Project Planning Mistakes?
Most plans fail not because of bad arithmetic but because of missing conversations. The most frequent mistakes are:
- Planning backwards from a date: Fixing the end date first and squeezing durations into it makes the plan unrealistic from day one.
- Asking someone else for the estimate: An estimate the owner wasn't involved in is an estimate nobody owns.
- Skipping dependencies: Planning each task on its own hides waiting time from the schedule.
- Not reflecting scope changes in the plan: Every added feature affects time and cost; a request accepted without updating the plan is a silent delay.
- Making the plan once and leaving it: A plan is a living document updated every week; one that isn't updated soon becomes a picture nobody looks at.
Should You Build a Project Plan in a Spreadsheet or Software?
A spreadsheet is enough for a handful of tasks and one project; once several projects share a team or clients need regular progress reports, project management software saves time.
| Topic | Spreadsheet | Project management software |
|---|---|---|
| Critical path | Calculated by hand with formulas | Calculated automatically from dependencies |
| Impact of a delay | Every date shifted by hand | Dependent tasks update automatically |
| Resource conflicts | Spotted by eye | Per-person utilization and conflict alerts |
| Status updates | Collected by the project manager | Each owner updates their own tasks |
| Reporting | Prepared by hand every week | Live in dashboards and the client portal |
Recommended reading: What is task tracking software? A guide to team, task and project tracking
How Can You Prepare Your First Project Plan in a Week?
Use the programme below to apply the seven lessons to your own project within a week:
| Day | What to do | Output |
|---|---|---|
| Day 1 | Write the goal, scope and out-of-scope items with the sponsor (Lesson 1) | Signed project definition |
| Day 2 | Build the work breakdown structure with the team (Lesson 2) | Work packages and owners |
| Day 3 | Collect three-point estimates from owners (Lesson 3) | Expected durations and risk list |
| Day 4 | Write down dependencies and calculate the critical path (Lessons 4–5) | Critical path and float |
| Day 5 | Draw the Gantt chart, place milestones and the resource plan, set up tracking (Lessons 6–7) | A project plan ready for approval |
Recommended reading: What Is an MVP?
Project Planning and Tracking with İnovabil
In the project management systems we build at İnovabil, the plan isn't a separate file; it's the system the team uses every day. Project templates, phases and milestones, task dependencies, an automatically calculated critical path with delay alerts, per-person utilization, time and budget tracking, and a portal where clients follow their own projects all come together in one structure.
Tell us in a few sentences how you plan projects today and where things go wrong most often, and we'll prepare a project management system roadmap tailored to you.
Recommended reading: Our software development process: from analysis to launch, step by step
Frequently Asked Questions
How do you create a project plan, and what are the steps?
A project plan is created in seven steps: writing the goal and scope, building the work breakdown structure, estimating task durations, identifying dependencies, calculating the critical path, preparing the Gantt chart and milestones, and setting up the resource plan and tracking routine.
What is the critical path and why does it matter?
The critical path is the chain of tasks from the start to the end of the project with the longest total duration. If a task on it slips, the project slips by the same amount. Knowing the critical path lets you focus resources and attention on the tasks that actually set the end date.
Is a Gantt chart the same as a project plan?
No. A Gantt chart is the schedule view of a project plan. The plan also covers scope, the work breakdown structure, duration estimates, dependencies, the resource plan, risks and the tracking method.
How do you calculate duration with PERT?
Take three durations for each task: optimistic, most likely and pessimistic. The expected duration is (Optimistic + 4 × Most likely + Pessimistic) ÷ 6. For estimates of 8, 12 and 16 days, for example, the expected duration is 12 days.
How often should a project plan be updated?
At least once a week and whenever something significant changes. Collect each task's percent complete from its owner, carry delays through to dependent tasks and track the schedule performance index (SPI). When a scope change is accepted, recalculate time and budget as well.