

Building a software idea from start to finish, launching it, and only then learning that users do not want it is the most expensive surprise a project can have. An MVP (minimum viable product) pulls that surprise forward at a fraction of the cost: you release the smallest real product that tests your riskiest assumption, learn from actual users, and only then expand.
In this guide we answer what an MVP is, how it differs from a prototype and a full product, how hypothesis-first scoping works, how to score 12 candidate features with one formula, why success metrics are written before the build, how much cost and time change, why an MVP does not mean low quality, and how to plan the roadmap afterwards. Every number is illustrative; none is a real project quote or an industry average.
What Is an MVP?
An MVP is the first release that carries just enough core functionality to test a product hypothesis, and that real users can use for real work. "Minimum" refers to the number of features; "viable" means the product works and can be trusted. What is missing is scope, not quality.
An MVP has three ingredients: a hypothesis to test, the smallest set of features that can test it, and the metrics that will read the result. If any one is missing, what you hold is not an MVP, just a half-finished product. We explained the definition and layers of bespoke software in our guide to custom software; an MVP is a way of running such a project that shrinks the risk.
We recommend reading: Our custom software service
What Is the Difference Between an MVP, a Prototype and a Full Product?
A prototype is built to show an idea, an MVP to test it, and a full product to scale a tested idea. They answer three different questions and cannot replace one another.
| Topic | Prototype | MVP | Full product |
|---|---|---|---|
| Purpose | Show the idea, collect feedback | Test the hypothesis with real usage | Scale a validated need |
| Users | A few people see a demo | A limited but real user group | The whole target audience |
| Data | Fake or sample | Real | Real |
| Working level | Clickable, no back end | Core flow works end to end | All flows and modules |
| Lifespan | Thrown away | Grows, built upon | Maintained |
| Output | Clarity about the idea | Measured learning | Lasting business value |
Screen flows and fidelity levels for prototypes are covered in our UX design guide; a short prototype round before the MVP is often a cheap insurance policy.
Why Do You Need an MVP?
Because the biggest risk in software projects is rarely technical; it is assumption. Will users want this feature, does the process really work this way, will anyone pay? If assumptions are tested only after the build and turn out wrong, the whole budget is already spent.
- Early learning: A wrong assumption surfaces within weeks and on a small budget.
- Money and time saved: You do not invest in features nobody uses.
- Real data: Decisions rest on usage numbers, not on guesses made in meetings.
- Internal support: A working release is the best way to win over managers and users.
The trade-off is that you do not get full scope immediately. In rare cases where the product must do everything on day one, such as a legal requirement, a full-scope plan is needed instead of the MVP approach.
How Does an MVP Start with a Hypothesis?
It starts with a one-sentence hypothesis, not a feature list: "Dealers prefer placing orders through a portal instead of by phone." That sentence says why the MVP exists and defines its scope.
A good hypothesis has three traits: it describes a single user group, it makes behavior measurable, and it can turn out wrong. "Users will love our product" cannot be tested; "at least half of 10 pilot dealers will place an order through the portal within the first two weeks" can.
- Write the problem: Who struggles with which task, and why?
- Rank the assumptions: Which assumption, if wrong, sinks the project? Pick the riskiest one.
- Form one hypothesis: Include a behavior and a number.
- Draw the flow that is enough to test it: Which steps must a user go through to show the behavior that confirms the hypothesis?
How to describe the problem and the user precisely is the subject of our requirements analysis guide; the MVP hypothesis is simply the riskiest line of that analysis.
How Do You Define MVP Scope? The Value × Risk ÷ Effort Method
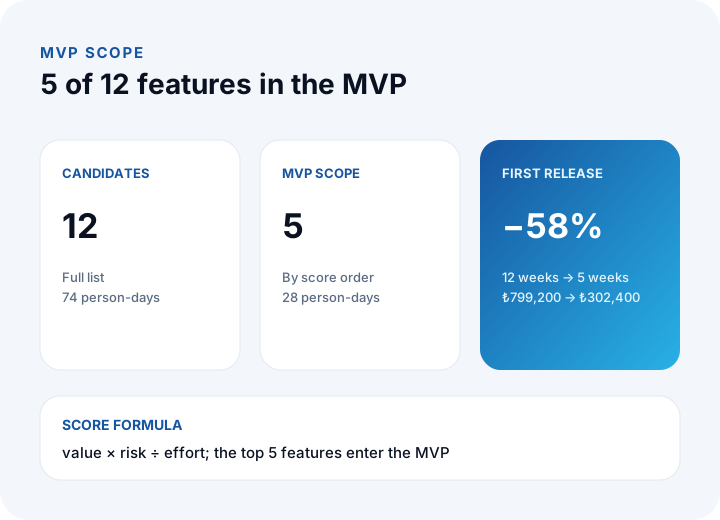
You give each candidate feature three scores and turn them into one number: score = value × risk ÷ effort. The highest-scoring features enter the MVP.
- Value (1–5): How necessary is this feature for testing the hypothesis?
- Risk (1–5): How much uncertainty surrounds this feature, in other words how much will we learn from it? A known, standard feature scores low; one whose outcome you genuinely wonder about scores high.
- Effort (person-days): The estimated working days to build it.
The logic: something valuable and uncertain should be built first, provided it can be built cheaply. For the dealer order portal example, 12 candidate features are scored like this (score = value × risk ÷ effort):
| Rank | Feature | Value | Risk | Effort | Score |
|---|---|---|---|---|---|
| 1 | Order history and reorder | 4 | 4 | 3 | 16 ÷ 3 = 5.33 |
| 2 | Cart and order placement | 5 | 5 | 8 | 25 ÷ 8 = 3.13 |
| 3 | Dealer-specific pricing | 5 | 4 | 7 | 20 ÷ 7 = 2.86 |
| 4 | Dealer login | 5 | 2 | 4 | 10 ÷ 4 = 2.50 |
| 5 | Product catalog and search | 5 | 3 | 6 | 15 ÷ 6 = 2.50 |
| 6 | Stock visibility | 4 | 3 | 6 | 12 ÷ 6 = 2.00 |
| 7 | Account balance view | 3 | 2 | 5 | 6 ÷ 5 = 1.20 |
| 8 | Online payment | 3 | 3 | 10 | 9 ÷ 10 = 0.90 |
| 9 | Mobile notifications | 2 | 2 | 5 | 4 ÷ 5 = 0.80 |
| 10 | Promotions module | 2 | 3 | 8 | 6 ÷ 8 = 0.75 |
| 11 | Advanced reports | 2 | 2 | 8 | 4 ÷ 8 = 0.50 |
| 12 | Multi-language interface | 1 | 1 | 4 | 1 ÷ 4 = 0.25 |
The top five features enter the MVP: 3 + 8 + 7 + 4 + 6 = 28 person-days. The whole list is 74 person-days (4 + 6 + 8 + 3 + 6 + 7 + 5 + 10 + 8 + 8 + 5 + 4). There is a clear step between the fifth and sixth features (2.50 versus 2.00), which is the benefit of drawing the cut line with a number instead of a hunch. Scores do not end the debate, but they move it onto a shared language; if two people give the same feature different scores, the gap shows that your assumption is not yet clear.
This method complements the Must, Should, Could classification used in requirements analysis: classification says what is mandatory, scoring says what to build first.
How Do You Measure MVP Success?
Success metrics are written before the build, because a target set after the results arrive turns into a defense of the results. For each metric, you fix a threshold and the decision that follows from it in advance.
| Metric | Calculation | Target | Example result |
|---|---|---|---|
| Active dealer rate | Dealers who ordered ÷ pilot dealers | At least 50% | 6 ÷ 10 = 60% |
| Repeat order rate | Dealers with a second order ÷ active dealers | At least 50% | 4 ÷ 6 = 66.7% |
| Order time | Time to complete an order | 12 min down to 5 min | 5 min |
| Support requests | Requests per dealer | Decrease | Tracked |
The decision rule is also written in advance: if the active dealer rate is 50% or higher, continue; between 25% and 50%, find the usage barrier and change course; below 25%, revisit the hypothesis or stop. That leaves no vague outcome such as "it is used a bit, let us keep going". These figures are illustrative; set your own thresholds from the real situation of your process.
How Does the Build, Measure, Learn Loop Work?
An MVP is not a one-off delivery but the first turn of a loop. Each turn sharpens the hypothesis, updates the scope, and ties the next decision to a number.
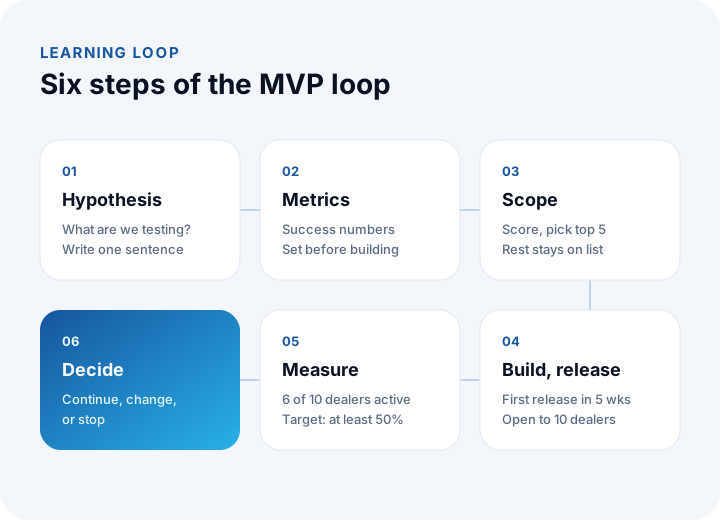
- Hypothesis: Write the single sentence you are testing.
- Metrics: Set success numbers and decision thresholds before building.
- Scope: Score the features, pick the top five, keep the rest on the list.
- Build and release: Build the core flow at real quality and open it to a limited user group.
- Measure: Collect the numbers you wrote down earlier; data before opinion.
- Decide: Continue, change, or stop. Re-score the list with what you learned.
For scheduling and release planning, see our project plan guide; the short MVP timeline is built with the same method (work breakdown, dependencies, critical path).
How Does the Cost of an MVP Compare with Full Development?
An MVP does not automatically reduce total project cost; it puts spending in order behind learning. In the dealer portal example, assume a day rate of ₺9,000 and a 20% uncertainty buffer (×1.2).
| Item | Full scope (12 features) | MVP (5 features) |
|---|---|---|
| Effort | 74 person-days | 28 person-days |
| Buffered effort (× 1.2) | 88.8 person-days | 33.6 person-days |
| Development cost (× ₺9,000) | ₺799,200 | ₺302,400 |
| First release duration | 12 weeks | 5 weeks |
| Difference at first release | ₺496,800 (62.2%) and 7 weeks (58.3%) | |
At first release you spend ₺799,200 − ₺302,400 = ₺496,800 less, which is ₺496,800 ÷ ₺799,200 ≈ 62.2%. Duration shrinks by (12 − 5) ÷ 12 ≈ 58.3%. The remaining seven features are not deleted; they wait on the list as 46 person-days (74 − 28) and are built according to what you learn. The money is still ₺496,800 in total, but it is spent only after the product has proven useful.
The real gain shows up in wrong-assumption risk. If you assume a 40% chance that the hypothesis is wrong, the expected loss is 0.40 × ₺799,200 = ₺319,680 for full scope and 0.40 × ₺302,400 = ₺120,960 for the MVP, a difference of ₺198,720. If your probability differs, redo the calculation. You will find cost items in detail in our software project cost guide, and the mobile-specific calculation in our mobile app cost guide.
Does an MVP Mean Low Quality?
No. An MVP has fewer features, but every feature it has works, is secure, and gives correct results. Handing users an order screen that calculates halfway is not an MVP, it is a faulty product, and it does not test the hypothesis; users reject the bug, not the idea.
| Must be in the MVP | Can be deferred |
|---|---|
| Correct calculations and data integrity | Advanced reports and dashboards |
| Role-based access and secure login | Extra languages and personalization |
| Backups and error logging | Promotions and loyalty schemes |
| A clear, short user flow | Extra channels and notification types |
| Respect for personal data (legal counsel for details) | Decorative visual layers |
Technically, writing the MVP as a throwaway is also a mistake: it should be built on a core that can grow. If a building will later stand on the code, the foundation is laid properly from the start; what you postpone is the extra floors.
How Do You Build the Roadmap After the MVP?
Once MVP results arrive, the waiting features are re-scored in light of what you learned and split into phases. In the example, let us divide the remaining 46 person-days into two phases.
- Phase 2 (21 person-days): Stock visibility (6), account balance (5), online payment (10); priority may shift depending on what dealers ask for most during the MVP.
- Phase 3 (25 person-days): Mobile notifications (5), promotions (8), reports (8), multi-language interface (4).
Check: 21 + 25 = 46 person-days, which is ₺496,800 (46 × 1.2 × ₺9,000). Each phase ends with a new measurement and decision point. If a pricier channel such as a mobile app is needed, testing the MVP on the web first is often the right order. At a high level, this flow fits the agile cycles in our software development life cycle guide.
What Are Common MVP Mistakes?
- A feature list without a hypothesis: Every "let us add this too" turns the MVP back into a full product.
- Setting metrics afterwards: A target set after seeing results produces excuses more than decisions.
- Cutting quality: A faulty first release tests trust, not the hypothesis.
- Testing with the wrong users: A pilot group outside the target audience gives misleading results.
- Not turning learning into a decision: Numbers are collected but nobody says continue, change, or stop.
- Treating the MVP as a finished product: An MVP is a beginning; without a roadmap it stalls.
- Ignoring architecture entirely: You must make a conscious choice between code to discard and code to grow.
We recommend reading: How to get custom software developed: brief, quote and contract guide
We recommend reading: What is B2B e-commerce? Dealer portal and scope guide
Recommended reading: What Is a Web Application?
Staged Custom Software and MVPs with İnovabil
At İnovabil our focus is building bespoke software from scratch: custom software, ERP, CRM, e-commerce, web, mobile and integration. Instead of delivering a large scope in one go, we suggest during requirements analysis that the core flow ships first and growth follows; the analysis, design, development, testing, release, maintenance and support steps described on our process page fit this approach.
We built CRM, purchasing and mobile for Avcılar İnşaat; a purchasing system for İZBAN; logistics and shipment planning with wholesale order management for Karyak; and warehouse management plus a complaint and support management system for Sleepy. Tell us briefly about your idea and target user; together we will write the hypothesis, score the candidates, and produce a written assessment of which scope is enough for the first release.
We recommend reading: Our software development process: step by step from analysis to release
Frequently Asked Questions
What is an MVP, in short?
MVP stands for minimum viable product: the working, trustworthy first release with the fewest features needed to test a hypothesis with real users. Its purpose is to learn on a small budget.
What is the difference between an MVP and a prototype?
A prototype shows an idea, usually works with fake data, and is thrown away. An MVP contains a core flow that works with real data, is opened to real users, and is built upon.
How do you define MVP scope?
First write a single hypothesis, then score candidate features with value × risk ÷ effort and pick the highest scorers. In the example, 5 of 12 features, 28 of 74 person-days, entered the MVP.
How long does an MVP take and what does it cost?
In the example, full scope came to 12 weeks and ₺799,200, while the MVP came to 5 weeks and ₺302,400 (₺9,000 per day, ×1.2 buffer). The figures are illustrative; real time and cost become clear through requirements analysis.
What happens after the MVP?
You read the metrics you wrote beforehand and decide to continue, change, or stop. The waiting features are re-scored from what you learned and split into phases, with a new measurement at the end of each.