

A piece of software is delivered, every feature works, and still nobody wants to use it. Dealers keep ordering by phone, because finding a product in the portal takes seven steps, the error message doesn't say what to do and the "Add to cart" button isn't where they look for it. The problem isn't the code; it's the design. UX (user experience) design is designing a product so that real people can do a job easily, quickly and without errors.
In this guide we answer how to do UX design step by step, using one example screen, from user research to usability testing and calculating a SUS score. It works like a short course: seven lessons, each with a concept, an example and an exercise. Our example screen is the dealer portal's order screen, familiar from earlier articles. You don't need to be a designer; if you commission, manage or accept software projects, you'll learn how to ask for good design and how to measure it.
What Is UX and How Does It Differ from UI?
UX (User Experience) is everything a person experiences while using a product: how easily they do their job, where they get stuck, what they trust and how they feel at the end. UI (User Interface) is the visible part of that experience: buttons, colors, typefaces and screen layout.
An analogy: UI is a restaurant's decor and menu design; UX is everything from sitting down to paying and leaving: finding a table, ordering, waiting, asking for the bill. The decor may be lovely, but if the waiter never comes, the experience is bad. Good UX starts before UI, by understanding who the user is, what they want to do and where they struggle.
Recommended reading: Our web development service: from corporate sites to customer and dealer portals
How Should You Use This Guide?
Follow the lessons in order; each uses the output of the previous one. All examples design the dealer portal's order screen. Figures are illustrative.
| Lesson | Topic | What you will be able to do |
|---|---|---|
| 1 | Users and problem definition | Write in one table who struggles with which job and why |
| 2 | User research | Pick the right method and turn findings into sentences |
| 3 | User flow | Reduce the number of steps in a task |
| 4 | Wireframes and prototypes | Test the design without writing code |
| 5 | Interface principles and accessibility | Audit a screen against principles |
| 6 | Usability testing and SUS | Test the design with real users and score it |
| 7 | Improvement and measurement | Show the effect of a design change in numbers |
Lesson 1: How Do You Define the User and the Problem?
UX design starts, before drawing a single screen, with written answers to three questions: who is using it, what job are they trying to do and why are they struggling? A design with no answers rests on the designer's guesses.
| Heading | In the example project |
|---|---|
| User | A dealer's order clerk; orders several times a week, mostly at a desk and in a hurry |
| Task | Quickly place a repeat order for products they already know |
| Today's obstacle | Finding a product takes many menus; there's no way to repeat the last order |
| Problem statement | Every week the dealer repeats the same steps to order the same products and gives up and phones the order in |
| Success criterion | Task success rate rises, order time falls, phoned-in orders drop |
The success criterion row is critical: it's how you'll later tell whether the design worked. "Make it user-friendly" is not a criterion; "place a known order in four steps" is.
Recommended reading: How to do software requirements analysis: problem statements and user stories
Lesson 2: How Do You Do User Research?
User research is learning how users actually do their work so you design from observation rather than guesses. No single method answers every question; you need to know which question is answered by which method.
| Method | What it teaches | Limitation |
|---|---|---|
| Interview | The user's goals, habits and reasons | People may describe what they think they do, not what they do |
| Observation | What the user really does and where they get stuck | Takes time, done with few people |
| Survey | How widespread an opinion is | Doesn't answer "why" |
| Usage data | Which screens are used and where users drop off | Doesn't say why |
| Support tickets and complaints | The most frequent problems | Reflects only those who complain |
A good interview doesn't ask "did you like this screen?"; it asks "walk me through how you placed your last order, step by step". A like-question gets a polite answer; a past-behavior question shows the truth. In observation, you watch quietly while the user does their work and don't intervene.
Turn findings into sentences that show who does what and with what result. For example: "Four of six dealer interviewees open an old order document and copy product codes from it before ordering." That sentence hands the design a decision: offer a way to type the product code or choose from the last order.
Lesson 3: How Do You Design a User Flow?
A user flow is the sequence of steps a task asks of the user from start to outcome. The measure of a good flow is brevity: every extra step is an obstacle that may make the user give up. As you draw the flow, ask for each step: "Do we have to ask the user for this, or can the system know it?"
In the example, today's flow is seven steps: after login, open the order screen from the menu, search for the product, pick it from a list, enter the quantity, open the cart and confirm the order. Based on the research findings, we can cut the new flow to four:
| Current flow (7 steps) | New flow (4 steps) | Decision |
|---|---|---|
| 1. Log in | 1. Log in; the order screen opens directly | The dealer comes to order anyway; the middle menu is unnecessary |
| 2. Open "Order" from the menu | 2. Type the product code or choose "Repeat last order" | Search and select merge into one field; frequent items come first |
| 3. Search for the product | ||
| 4. Pick the product from the list | 3. Enter the quantity; the cart shows at the side | The cart is a live summary beside the screen, not a separate page |
| 5. Enter the quantity | ||
| 6. Open the cart | 4. Confirm the order | The open-the-cart step disappears |
| 7. Confirm the order |
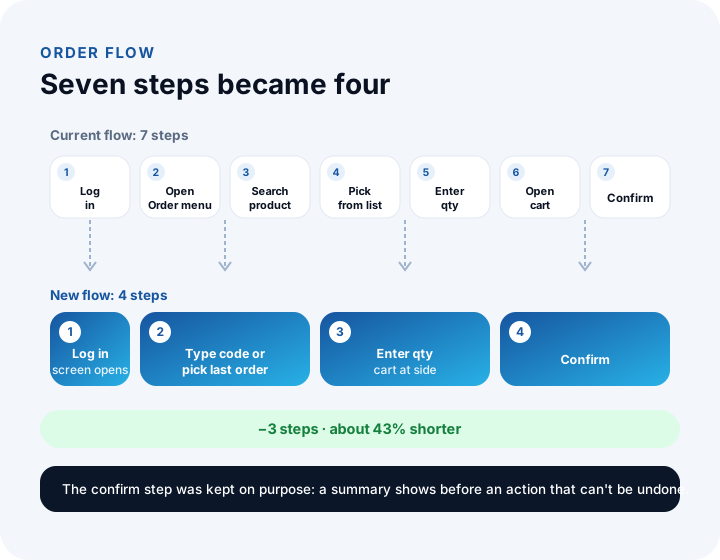
The reduction in steps: (7 − 4) ÷ 7 ≈ 43%. But a shorter flow isn't always a better one. Before an important action that can't be undone (confirming an order, say), the user needs to see a summary; that's why the confirmation step was kept and the cart summary stays visible beside the screen.
Lesson 4: How Do You Create Wireframes and Prototypes?
A wireframe is the skeleton of a screen stripped of visual decoration: it shows what element goes where, which stands out and what it does. A prototype is the clickable version of those screens. Both exist to make changes before code is written, where they are cheapest.
| Fidelity | What it is | What it's for |
|---|---|---|
| Paper or whiteboard sketch | Rough hand-drawn screens | Trying many ideas fast |
| Grey wireframe | A colorless layout skeleton without real content | Discussing placement and flow |
| Clickable prototype | A model with transitions between screens, close to real content | Testing with users, showing stakeholders |
| Visual design | Final look with color, typography and imagery | Handoff to development, brand fit |
The rule is simple: work at low fidelity while decisions are uncertain and at higher fidelity as they settle. Starting with visual design makes debates about color and typeface overshadow the real flow question. The wireframe decisions for our example screen were: the product code field at the top of the screen and auto-focused, a "Repeat last order" button right beside it, the cart summary fixed on the right and the confirm button below the cart summary.
Lesson 5: Which Principles Should You Audit an Interface Against?
Auditing a design against established principles before showing it to users catches obvious problems ahead of testing. The principles below are chosen from the widely accepted heuristic evaluation principles of usability; each is applied to the example screen.
| Principle | Meaning | On the order screen |
|---|---|---|
| Show system status | The user always knows what's happening | The cart total updates instantly as quantities change |
| Speak the user's language | The user's own words | "Product code" as dealers know it, not "stock code" |
| Give users control and freedom | Easy to go back after a mistake | Removing items from the cart, editing before confirming |
| Be consistent | The same thing looks and behaves the same everywhere | The confirm button has the same color and position on every screen |
| Prevent errors, explain them if made | An error message says what happened and what to do | "Quantity can be 500 at most" (not just "Invalid value") |
| Recognition over recall | Users shouldn't have to memorize anything | Suggestions while typing a product code, last orders visible |
Accessibility is a separate audit and is necessary for everyone to use the product. The basic checklist: contrast between normal text and background of at least 4.5:1 (the WCAG AA criterion); tappable areas large enough for a finger; a visible label on every form field; information not conveyed by color alone (show an error with an icon and text as well as red); every action doable by keyboard; images with text alternatives.
Lesson 6: How Do You Run a Usability Test and Calculate a SUS Score?
A usability test gives real users realistic tasks on a prototype and watches them to find where the design trips them up. You don't ask users "is the screen nice?"; you say "try to place an order for these products" and watch quietly.
Write tasks as outcomes, not as steps: "Order 10 units of product code MUT-TRM-500-CLK" is a task; "click the product code field" is an instruction. Giving instructions tells users what to look for and where, and makes the test meaningless. Ask users to think aloud, don't intervene and note where they get stuck.
How many users should you test with?
The problem discovery model gives the share of problems found by n users from the probability (p) that each user finds a problem: Share of problems found = 1 − (1 − p)ⁿ. We take p = 0.30 in the example (illustrative; the real value varies from project to project).
| Number of users | Calculation | Share of problems found |
|---|---|---|
| 1 | 1 − 0.70 | 30.0% |
| 3 | 1 − 0.70³ | 65.7% |
| 5 | 1 − 0.70⁵ | 83.2% |
| 8 | 1 − 0.70⁸ | 94.2% |
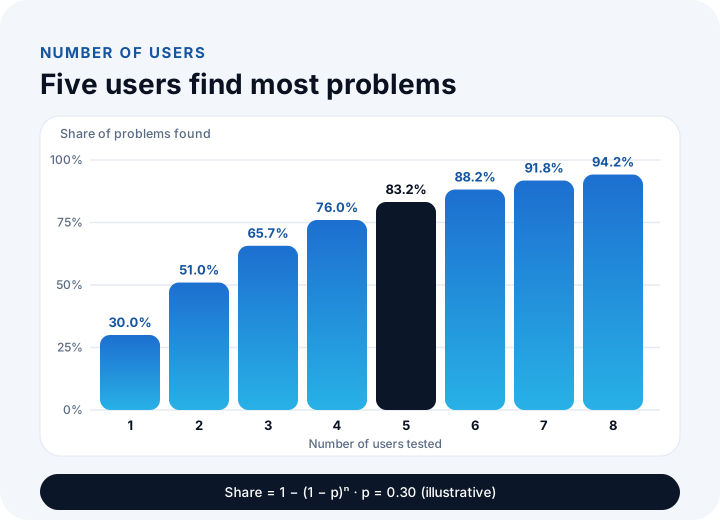
The curve flattens: the fifth user alone adds 83.2% − 76.0%, about 7 points. That's why testing with small groups, fixing and retesting is more efficient than testing many people at once.
How is a SUS score calculated?
SUS (System Usability Scale) is a standard questionnaire that summarizes usability in a single 0–100 score. After a task, the user rates ten statements from 1 (strongly disagree) to 5 (strongly agree); odd-numbered statements are positive, even-numbered ones negative. Odd item contribution = answer − 1; even item contribution = 5 − answer; SUS = total contribution × 2.5.
| Statement | 1 | 2 | 3 | 4 | 5 | 6 | 7 | 8 | 9 | 10 |
|---|---|---|---|---|---|---|---|---|---|---|
| User's answer | 4 | 2 | 4 | 1 | 4 | 2 | 5 | 2 | 4 | 2 |
| Contribution | 3 | 3 | 3 | 4 | 3 | 3 | 4 | 3 | 3 | 3 |
The odd items contribute 3 + 3 + 3 + 4 + 3 = 16, the even items 3 + 4 + 3 + 3 + 3 = 16; total 32. SUS = 32 × 2.5 = 80. A product's SUS is the average of all participants' scores, not one user's. A SUS score is not a percentage; to interpret it, compare it with your product's previous version. In the literature, about 68 is commonly used as a reference value.
Recommended reading: How to do software testing: acceptance testing and test cases
Lesson 7: How Do You Measure the Effect of a Design Change?
UX work isn't done once; it's a test–fix–retest loop. At the end of each round the same metrics are measured and the rounds compared, so you can see in numbers whether the change worked. There are three core metrics: task success rate, task time and SUS score.
In the example six users tried five tasks: 6 × 5 = 30 attempts. In round one 19 succeeded: task success rate = 19 ÷ 30 ≈ 63.3%. Based on the findings, the flow was cut to four steps, error messages were rewritten and "Repeat last order" was added. In round two the same tasks were tried again:
| Metric | Round 1 (old design) | Round 2 (new design) | Change |
|---|---|---|---|
| Number of steps | 7 | 4 | Down 3 steps (43%) |
| Task success rate | 19 ÷ 30 ≈ 63.3% | 27 ÷ 30 = 90.0% | Up 26.7 points |
| Average task time | 4 min 10 s (250 s) | 2 min 20 s (140 s) | (250 − 140) ÷ 250 = 44% shorter |
| SUS score (average) | 62 | 80 | Up 18 points |
This table moves the design decision from a taste debate to data: instead of "the new flow looks better", "task success rose about 27 points and time fell 44%". After launch, keep tracking the same metrics from real use: the number of phoned-in orders, how many seconds an order takes on screen and the screen abandonment rate show the design's real-world result.
What Are the Most Common UX Design Mistakes?
Most UX mistakes come not from lack of design talent but from leaving users out of the process. The most frequent are:
- Designing without asking users: The team's or the manager's taste replaces the user's need.
- Starting with visual design: Debates about color and typeface overshadow the real flow problem.
- Leaving testing to the end: A flow bug found after coding costs far more than one found in a prototype.
- Giving users instructions: A test where you say "click here" finds no problems.
- Testing yourself or the team: Someone who knows the product can't see where those who don't will stumble.
- Leaving accessibility to the end: Contrast, labels and keyboard support are hard to fix later if not considered from the start.
We recommend reading: How to Build a Mobile App: A Step-by-Step Guide from Idea to Store Launch
We recommend reading: Mobile App Development Cost: A Guide to Effort, Scope, MVP and Three-Year Total Cost
We recommend reading: What is help desk software? Ticket life cycle, priority matrix, SLA compliance and team sizing guide
Recommended reading: What Is a Web Application?
UX Design with İnovabil
At İnovabil we design screen flows and the data model before writing code. As our process page describes, we make changes at the stage where they're cheapest by seeing how users will move through the screens; user flows and screen sketches, a clickable prototype and visual interface design are part of our design step. Your feedback on the sketches steers the next step. For mobile apps, we design screens to suit iOS and Android conventions.
Tell us in a few sentences who will use your software, for which job and where they struggle today, and we will prepare a design and prototype roadmap tailored to you.
Recommended reading: Our software development process: from analysis to launch, step by step
Frequently Asked Questions
How do you do UX design, and what are the steps?
UX design is done in seven steps: defining the user and problem, doing user research, designing the user flow, building wireframes and prototypes, auditing the interface against principles and accessibility, usability testing, and measuring results to improve the design.
What is the difference between UX and UI?
UX is everything the user experiences with a product: how easily they do their job, where they get stuck and how they feel. UI is the visible part of that experience: buttons, colors, typefaces and layout. Good UI is part of good UX but doesn't replace it.
How many users should a usability test have?
There's no fixed number; the problem discovery model gives 1 − (1 − p)ⁿ. For example, if each user has a 0.30 chance of finding a problem, five users find about 83% of problems. Testing with small groups, fixing and retesting is more efficient than testing many people at once.
What is a SUS score and how is it calculated?
SUS (System Usability Scale) is a ten-statement questionnaire that summarizes usability on a 0–100 scale. For odd items you take answer − 1, for even items 5 − answer, add the contributions and multiply by 2.5. The score is not a percentage; interpret it by comparing with the product's previous version.
How do you measure the effect of UX design?
Task success rate, task time and SUS score are measured with the same tasks before and after a design change. After launch, real usage data such as order completion time, screen abandonment rate and the number of support requests are tracked too.