

When month-end arrives, someone downloads the sales report from the ERP, the collections list from accounting and the order export from the e-commerce panel, and merges them all in Excel. By the time the report is ready, days have passed, and two departments show up to the same question with different numbers. Business intelligence (BI) is the set of methods and software that automatically gathers this scattered data in one place so that managers see the right number at the right time.
In this guide we explain what business intelligence is, what it is for, how it works from data sources to dashboard, how it differs from classic reporting, which indicators are tracked by department, the difference between off-the-shelf BI tools and custom business intelligence, the steps of a BI project and the common mistakes. By the end you will also be able to assess how ready your company is for business intelligence.
What Is Business Intelligence (BI)?
Business intelligence is the set of processes and software that collects a business's data from different systems, cleans it, merges it into a single model and presents it to decision makers through dashboards, reports and alerts. In short, it is the infrastructure that turns data into decisions.
Two words matter here: "collect" and "combine". In most businesses the data already exists; the problem is that it sits scattered across the ERP, the CRM, the accounting program, the e-commerce site, marketplace panels and dozens of Excel files. Each system is correct from its own point of view, but none shows the whole picture. Business intelligence brings these pieces together and makes it possible to answer questions that no single system can, such as "which product, sold through which channel to which customer, actually leaves a profit?"
Business intelligence is not a product name but an approach. It can be built with the general-purpose BI tools on the market, or developed specifically around a company's systems and indicators. We cover which one fits later in this article.
We recommend reading: Our business intelligence and reporting service
What Is Business Intelligence For?
Business intelligence answers "what happened, why did it happen and what is happening now?" in a current and consistent way, without anyone preparing reports by hand. In a business, this shows up in a few ways:
- One true number: Sales, finance and operations look at the same number calculated with the same definitions; meetings are not spent arguing about which figure is right.
- The end of report preparation: The Excel merging work repeated every month and every week disappears; reports update themselves.
- Faster detection: A drop in sales, a rising return rate or a delayed collection is seen without waiting for month-end; an alert arrives when a threshold is crossed.
- Drilling down: From the total you go to region, from region to branch, from branch to product and customer in a few clicks, and the source of a problem is found.
- Profitability becomes visible: You can manage profit, not revenue; the real profit left after commission, shipping, returns and discounts is visible by channel and product.
- Target tracking: Individual, team and branch targets are followed against actuals on the same screen.
How Does Business Intelligence Work?
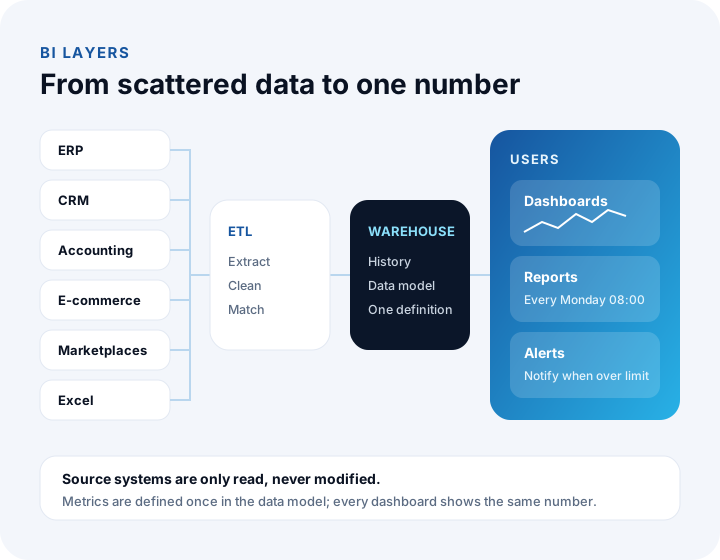
Business intelligence is data's journey from source to decision: data is pulled from sources, cleaned and transformed, stored in a data warehouse, tied to a data model with business rules, and delivered to users as dashboards, reports and alerts. Each layer has its own job.
Data sources
The ERP, CRM, accounting program, e-commerce site, marketplace panels, shipping systems, production machines, call center and Excel files are typical data sources. They are reached through an API, a database connection or regular file transfers. The source systems are not changed in this process; they are only read.
ETL: extract, transform, load
ETL (Extract, Transform, Load) is the layer where data is pulled from sources, cleaned and brought into a common format. Duplicate records are removed, the same customer or product in different systems is matched, currencies and units are harmonized, and missing fields are filled in by rule. Most of the effort in a business intelligence project goes into this layer, and the reliability of the result depends on it.
Data warehouse
A data warehouse is a separate database in which cleaned data is stored for analysis. Source systems are designed for day-to-day transactions; running heavy reports on them slows them down. A warehouse is designed for queries and analysis and also keeps history. That way a comparison such as "against the same week last year" can be made even if the source system has deleted the old record.
Data model and business rules
The data model defines how tables relate to each other and how indicators are calculated. Questions like "Is net sales calculated after returns?", "On which date does an order count as a sale: order, invoice or delivery?" and "Does profit include shipping cost?" are answered once here, and all dashboards use the same definition. The secret of one true number lives in this layer.
Dashboards, reports and alerts
This is the layer the user sees. Management dashboards keep summary indicators live, reports are prepared at set intervals and sent to the relevant people, and alerts notify you immediately when an indicator crosses a threshold. Through permission management everyone sees only the data they should: a regional manager sees their own region, a dealer sees their own orders.
We recommend reading: What is API integration? A guide to connecting systems
What Is the Difference Between Business Intelligence and Classic Reporting?
Classic reporting shows what happened at a specific moment, usually by hand and from a single source; business intelligence merges several sources automatically, is always current and lets the user dig deeper into a question on their own. The table below shows the difference item by item.
| Topic | Classic reporting with Excel | Business intelligence |
|---|---|---|
| Data collection | Manual export and copying every time | Automatic, scheduled pulls from sources |
| Freshness | As of the moment the report was prepared | Current at set intervals or in real time |
| Number of sources | Hard to combine, usually a single source | Several systems in one model |
| Consistency of definitions | The formula may differ in every file | Indicators are defined once, centrally |
| Drilling down | You have to request a new report | The user clicks down to the breakdown |
| Risk of error | Prone to copy-paste and formula errors | Rules are fixed, no repeated handling |
| Alerts | None; a problem is noticed when the report is read | Automatic notification when a threshold is crossed |
| Permissions | Whoever the file was sent to sees it | Role-based and row-level access control |
This does not mean Excel goes away. Excel remains a powerful tool for analysis and calculation; business intelligence makes sure the data going into Excel is correct, current and from a single source. Many BI solutions also let users export the table they see to Excel.
Which Indicators (KPIs) Are Tracked by Department?
Which indicator to track depends on which decisions the department makes. A KPI (Key Performance Indicator) is a measure of how close you are to a target. The table below gives examples of indicators commonly defined in business intelligence projects; every business's list is shaped by its own work.
| Department | Example indicators | Question it answers |
|---|---|---|
| Management | Revenue, gross profit, cash position, target achievement | Where is the company against its targets? |
| Sales | Sales by channel and region, average basket, conversion rate | Where do sales come from and where do they get stuck? |
| Marketing | Sales by campaign, return on ad spend, number of new customers | Which campaign really pays off? |
| Finance | Receivables aging, cash flow projection, budget versus actuals | Will there be enough cash in the coming weeks? |
| Inventory and warehouse | Inventory turnover, days in stock, stock-out risk | Which product has tied up capital and which is about to run out? |
| Production | Plan attainment, scrap rate, unit cost, downtime | Is production running as planned and at the planned cost? |
| Purchasing | Supplier lead time, price change, order fulfillment rate | Which supplier is reliable and which is raising costs? |
| Customer service | Number of requests, resolution time, return reasons | Why are customers unhappy? |
In Which Situations Does Business Intelligence Make a Difference?
Business intelligence makes a difference wherever data is scattered across several systems and decisions require combining it. Below we summarize some common scenarios.
Businesses that sell through several channels
For a business that sells through dealers, stores, its own e-commerce site and several marketplaces, revenue alone is misleading. Every channel has a different commission, shipping cost, return rate and discount structure. Business intelligence deducts these items by channel and product and shows which channel actually leaves a profit, so pricing and stock allocation rest on numbers.
Manufacturing businesses
In manufacturing, when the recipe and cost data in the ERP, production data from machines and sales data are combined, the real unit cost and profitability become visible. The gap between planned and actual cost, scrap rates and the causes of downtime are monitored on the same dashboard.
We recommend reading: What is ERP and what is it for? A guide to ERP for businesses
Multi-branch and multi-company structures
In structures with several branches or group companies, collecting every unit's data with the same definitions and consolidating it takes weeks when done by hand. Business intelligence automates branch comparison, regional breakdown and group consolidation.
Fast-growing businesses
As order volume and team size grow, the era in which "the manager knows everything" ends. Which channel growth comes from, whether costs are rising faster than growth, and cash needs can only be managed with reliable data.
Off-the-Shelf BI Tool or Custom Business Intelligence?
If you have a data team and your sources can be read easily through ready-made connectors, a general-purpose BI tool is a good start; if data preparation is complex, your indicators are specific to your company, or dashboards need to run inside your own software, custom business intelligence is a better fit.
General-purpose tools such as Power BI offer strong visualization and a wide range of connections. But these tools are a "blank canvas": your team or a consultant has to build the data connections, cleaning rules, data model and dashboards. In custom business intelligence, the data layer, business rules, dashboards, alerts and permissions are designed from scratch around your systems and decision processes.
| Topic | General-purpose BI tool | Custom business intelligence |
|---|---|---|
| Getting started | Fast; the tool is ready, you build the model and dashboards | Requires analysis and development time |
| Data preparation | With the transformation features the tool offers | ETL and warehouse written for your sources |
| Indicators | As many as your team defines | Designed together around your decision processes |
| Where it is used | The tool's own interface | In your own panel, portal or mobile app |
| Connection to workflow | Usually limited to viewing | Actions such as opening a task from an alert or sending for approval |
| License | According to the product's license model | Development and maintenance; no per-user license |
| Best suited to | Businesses with a data team and standard sources | Complex sources, unique indicators, embedded dashboards |
The two paths are not mutually exclusive. A custom-built data warehouse can also be the source for a general-purpose BI tool. The real investment is the data layer; the visualization tool sits on top of it.
We recommend reading: Off-the-shelf or custom software? A decision guide
How Do You Set Up a Business Intelligence Project?
A successful business intelligence project starts not from the dashboard but from the questions. A dashboard drawn before it is clear which decision will be made with which number looks nice but goes unused. A typical project moves through six steps.
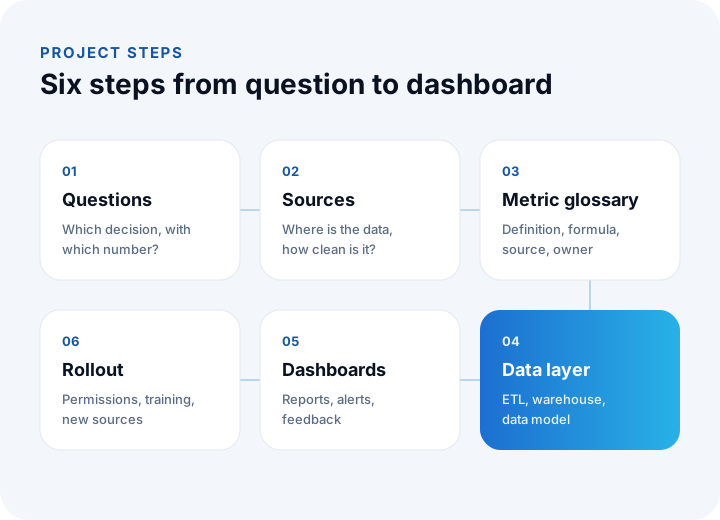
- Decision questions: Through interviews with management and departments, list which decisions are made regularly and which questions must be answered for them.
- Source inventory: Examine where the data needed to answer the questions sits, how those systems can be accessed and how clean the data is.
- Metric glossary: Write down the definition, formula, source and owner of every indicator, so that "net sales", "active customer" and "overdue collection" mean the same thing to everyone.
- Data layer: Connections, ETL flows, the data warehouse and the data model are built, and results are validated against the sources.
- Dashboards, reports and alerts: The most needed dashboard goes live first and is improved with user feedback; automatic reports and alert thresholds are defined.
- Rollout and maintenance: Permissions are set, users are trained, new sources and indicators are added over time, and data flows are monitored.
We recommend reading: Our software development process: step by step from analysis to launch
What Are the Most Common Mistakes in Business Intelligence Projects?
Most business intelligence projects struggle not for technical reasons but because of missing definitions and ownership. The most common mistakes are these:
- Starting with the dashboard: Dashboards drawn before the data layer is solid lose trust at the first inconsistent number and are never opened again.
- Not writing down indicator definitions: If "sales" means orders to the sales team and invoices to accounting, two dashboards show two different numbers.
- Ignoring data quality: If customer records in the source system are duplicated and product codes are inconsistent, business intelligence only makes the problem more visible. Cleaning rules must be part of the project.
- Wanting everything at once: Starting with the most critical question, instead of launching every department's dashboards at the same time, shows value early and speeds up the project.
- Indicators with no owner: If it is unclear who acts when an indicator gets worse, the dashboard remains just a monitoring screen.
- Leaving permissions to the end: Sensitive data such as salaries, costs and profitability must be protected with the right permission rules from the start.
Is Your Business Ready for Business Intelligence?
If your data is kept in a digital system and you prepare the same report by hand every period, there is enough ground to start business intelligence. Your answers to the questions below show your readiness level:
| Question | If the answer is "yes" |
|---|---|
| Are our sales, inventory and finance data kept in software? | The data layer can begin |
| Do we prepare the same report by hand every month? | Quick win with automatic reports |
| Do departments come to the same question with different numbers? | Start with the metric glossary |
| Do we have several sales channels or branches? | Channel and branch profitability dashboard |
| Do we usually notice problems only at month-end? | Start with alerts |
| Do some of our systems not talk to each other? | Integration first, then BI |
| Is there someone on our team who can build a data model? | If not, consider a custom build |
We recommend reading: Our integration and API development service
We recommend reading: What Is Digital Transformation? A Maturity, Roadmap and Payback Guide for Small and Mid-Sized Businesses
We recommend reading: What is help desk software? Ticket life cycle, priority matrix, SLA compliance and team sizing guide
Recommended reading: How to Choose a Database?
Business Intelligence with İnovabil
At İnovabil we treat business intelligence not as the job of drawing a dashboard but as a data project that starts from your company's decision questions. First we work out together which decision will be made with which number and write the metric glossary, then we build the data layer that automatically collects data from sources such as your ERP, CRM, accounting, e-commerce and marketplaces.
We design dashboards, automatic reports, alerts and role-based permissions around your needs and, if you wish, embed them inside your own management panel, dealer portal or mobile app. Because the same team also develops the integrations that connect your systems while the data layer is built, we manage the data's journey from source to dashboard end to end.
Tell us in a few sentences which systems you use and which reports you prepare by hand each period, and we will prepare a business intelligence roadmap for you.
Frequently Asked Questions
What is business intelligence (BI), in short?
Business intelligence is the set of processes and software that automatically collects and cleans a business's data from different systems, merges it into a single model and presents it to decision makers through dashboards, reports and alerts.
Do we have to use an ERP for business intelligence?
No. An ERP is an important data source but not a requirement. An accounting program, a CRM, an e-commerce site, marketplace panels and regularly maintained Excel files can also be sources for business intelligence. What matters is that the data is kept digitally and in an orderly way.
Are business intelligence and data analytics the same thing?
They are close concepts. Business intelligence focuses more on monitoring current and historical data through regular reporting, dashboards and indicators. Data analytics is a broader field that also includes deeper statistical analysis, forecasting and building models on that data.
How long does a business intelligence project take?
It depends on the number of source systems, how clean the data is and the scope of the indicators. Usually you start with the most critical decision question, the first dashboard goes live before the project ends, and other departments and sources are added in later steps.
If we already use Power BI, do we still need custom business intelligence?
You might. A general-purpose tool can be enough for visualization, but if data preparation is complex, your indicators are specific to your company, or dashboards need to run inside your own software, a custom data layer and custom dashboards make a difference. A custom-built data warehouse can also be the source for your existing tool.