

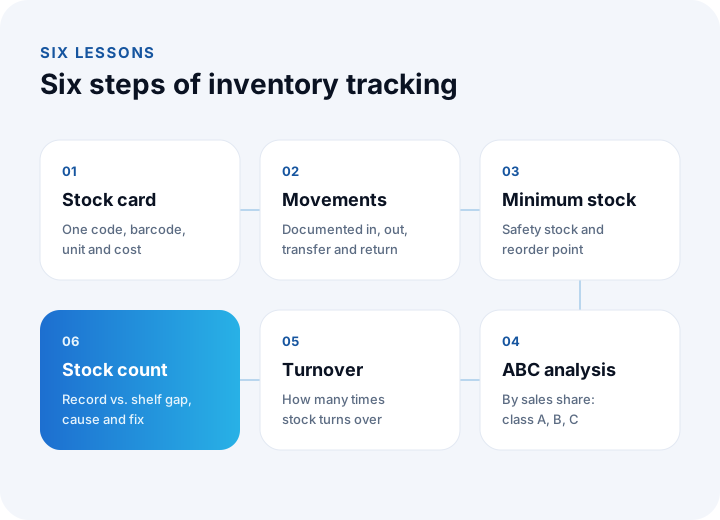
An order arrives but the shelf is empty; or the opposite, products that have not moved for months sit in the warehouse like tied-up capital. Behind both is the same question: how do you track inventory so that you always know how much of each product you have, when it will run out and when to reorder? The answer is not buying software first; it is applying a few basic rules and five or six formulas correctly.
We built this guide like a course. There are six lessons; each explains one concept, shows it with a worked calculation and ends with a small task for you to apply. At the end you will find a 30-day implementation plan and a comparison showing when your business should move to software.
What Is Inventory Tracking and Why Do It?
Inventory tracking is the regular monitoring of the quantity, location and value of products, raw materials and semi-finished goods through receipt, issue and count movements. Its purpose is to answer three questions at any time: How much do we have? How long will it last? When and how much should we order?
A business that does not watch its stock loses in two directions. Too little stock means lost sales, late orders and lost customers. Too much stock means warehouse rent, tied-up capital and spoiled or obsolete goods. Inventory tracking puts the balance between these two extremes on data: enough, but not more than needed.
How Should You Use This Guide?
Follow the lessons in order; each builds on the previous one. The figures in the examples are illustrative, so you need to recalculate with your own product data. The table below summarizes what the six lessons teach and what you will be able to do at the end.
| Lesson | Topic | What you can do afterwards |
|---|---|---|
| 1 | Stock card and product code | Define every product with a single code and complete information |
| 2 | Stock movements | Record receipts, issues, transfers and returns, and calculate stock |
| 3 | Minimum stock and reorder point | Answer "when should I order?" with a formula |
| 4 | ABC analysis | Decide how much attention each product deserves |
| 5 | Inventory turnover | Measure how efficiently your stock works |
| 6 | Stock count | Find and close the gap between records and the shelf |
We recommend reading: Our ERP software service: stock, purchasing and production in one system
Lesson 1: How Do You Prepare a Stock Card and Product Code?
The first step of inventory tracking is opening a stock card in which every product has a single, unchanging code. Recording the same product under two names, or two products under one code, breaks every later calculation. A code should be meaningful enough that someone who does not know the product can tell its category, but short enough not to be confused.
A common coding structure combines category, product and variant. For example MUT-TRM-500-CLK: kitchen category, thermos, 500 ml, steel. Each variant of the same product, such as colour or size, becomes its own stock card, because stock is kept at variant level.
| Field | Why it is needed | Example |
|---|---|---|
| Stock code | Identifies the product uniquely | MUT-TRM-500-CLK |
| Product name and variant | Read by people, used in search | Steel Thermos 500 ml, steel |
| Barcode | Error-free recording by scanning | EAN-13 |
| Unit and units per case | Conversion between unit, case and pallet | Unit; 1 case = 12 units |
| Purchase and sales price | Stock value and profit calculation | Unit cost, list price |
| Minimum stock and lead time | Reorder point calculation (Lesson 3) | Minimum 60 units; 7 days |
| Supplier | Source to order from | Primary and backup supplier |
| Warehouse and shelf address | Shortens the time to find the product | Main warehouse, B-3-02 |
Lesson 2: How Do You Record Stock Movements?
Stock is not a number held on its own; it is the sum of movements. Each product's stock is calculated with this formula: Current stock = Opening stock + Receipts − Issues. So the way to keep stock accurate is to record every receipt and issue, not to overwrite the stock number by hand.
Six movement types cover the needs of the great majority of businesses:
| Movement | Effect on stock | Related document |
|---|---|---|
| Purchase receipt | Increases | Purchase invoice, waybill |
| Sales issue | Decreases | Sales invoice, dispatch waybill |
| Customer return | Increases | Credit note, return form |
| Return to supplier | Decreases | Return waybill |
| Transfer between warehouses | Does not change the total; changes location | Transfer slip |
| Wastage, damage and count adjustment | Decreases or increases | Adjustment slip and reason |
Example: A product starts the month at 400 units. During the month there are 300 units of purchase receipts, 520 units of sales issues and 6 units recorded as damaged. Month-end stock is 400 + 300 − 520 − 6 = 174 units. If the shelf count shows 174, your records are sound; if not, the gap points to a movement that was left unrecorded.
The key to the rule is this: every movement needs a document, and every document needs a movement. Goods leaving without an invoice, goods arriving without a waybill and adjustments without a reason are the three main sources of stock differences.
Lesson 3: How Do You Calculate Minimum Stock and the Reorder Point?
The reorder point is the stock level at which a new order must be placed; it equals the goods sold during the lead time plus the safety stock. If you order when a product falls to this quantity, the shelf does not empty before the new goods arrive.
The calculation uses three inputs: average daily sales, lead time (days from order to goods receipt) and safety stock (a buffer against demand or supply variation).
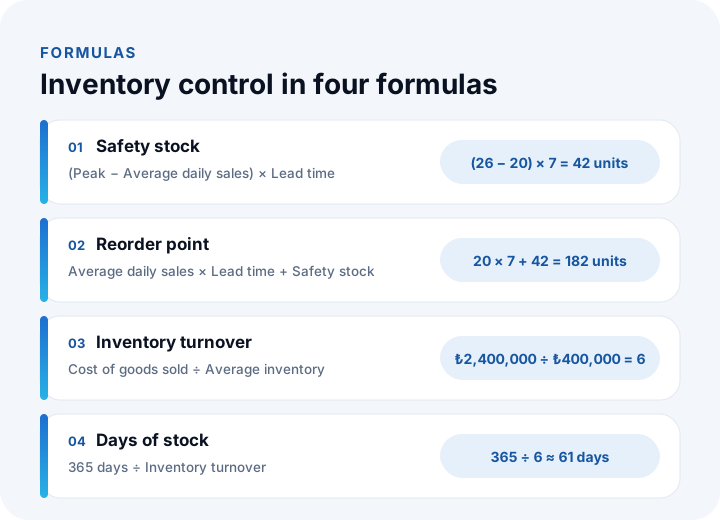
- Safety stock = (Peak daily sales − Average daily sales) × Lead time
- Reorder point = Average daily sales × Lead time + Safety stock
Example: A product sells 20 units a day on average and 26 on the busiest day; the supplier delivers in 7 days. Safety stock is (26 − 20) × 7 = 42 units. The reorder point is 20 × 7 + 42 = 182 units. You order the day stock falls to 182; 140 units are sold before the goods arrive, leaving a 42-unit buffer.
This formula assumes the product's sales speed is relatively steady. For seasonal products, use the average of the relevant period instead of the overall average daily sales; before a campaign, expected demand must be raised by hand. In most businesses the minimum stock concept corresponds to this safety stock: the lower limit that stock should not fall below under any circumstances.
Lesson 4: How Do You Do an ABC Analysis?
ABC analysis ranks products by annual sales value (or stock value) and splits them into three classes: the few A products that do most of the business, B products at a middle level, and the many C products with a small share. Class A is watched closely; class C is managed with simple rules.
The method has five steps: work out each product's annual sales value; sort from largest to smallest; find each product's share of the total; add the shares from top to bottom to get the cumulative percentage; classify by cumulative percentage. Commonly used thresholds are up to 80% for A, 80–95% for B and the rest for C; these thresholds can be adjusted to your business.
| Product | Annual sales | Share | Cumulative | Class |
|---|---|---|---|---|
| Product 1 | ₺400,000 | 40% | 40% | A |
| Product 2 | ₺250,000 | 25% | 65% | A |
| Product 3 | ₺150,000 | 15% | 80% | A |
| Product 4 | ₺100,000 | 10% | 90% | B |
| Product 5 | ₺60,000 | 6% | 96% | C |
| Product 6 | ₺40,000 | 4% | 100% | C |
In the example, three products carry 80% of sales. For these three, safety stock is recalculated often, counts are weekly and you work closely with the supplier. For class C, a monthly check and a fixed minimum quantity are enough. ABC analysis prevents the mistake of giving every product the same effort.
Lesson 5: How Do You Calculate Inventory Turnover?
Inventory turnover shows how many times stock is sold and replaced in a given period. The formula is: Inventory turnover = Cost of goods sold ÷ Average inventory. Average inventory is (opening inventory + closing inventory) ÷ 2. All values must be kept in the same unit, that is, at cost.
Example: Annual cost of goods sold is ₺2,400,000. Inventory value is ₺350,000 at the start of the year and ₺450,000 at the end, so average inventory is (350,000 + 450,000) ÷ 2 = ₺400,000. Turnover is 2,400,000 ÷ 400,000 = 6. In other words, stock turns six times a year. To convert it to days: Days of stock = 365 ÷ Turnover = about 61 days. A product waits on the shelf for roughly two months.
Turnover on its own is not a good or bad number; it gains meaning with the sector and product type. It is normal for it to be very high in fresh food and low in machine spare parts. The real value is in comparing your own periods and product groups: falling turnover may mean tied-up capital is growing, rising turnover may mean the risk of stockouts is growing.
We recommend reading: What is business intelligence (BI)? A guide from data to decisions
Lesson 6: How Do You Do a Stock Count?
A stock count compares the actual quantity on the shelf with the quantity in the records and closes the differences. The formula is simple: Count difference = Counted quantity − Recorded quantity; the value of the difference is that quantity times the unit cost. A count is verification; it does not replace the record.
| Topic | Periodic (full) count | Cycle count |
|---|---|---|
| When | At year end or at set periods | Every day or week throughout the year |
| Scope | Whole warehouse at once | Specific products or shelves each time |
| Warehouse activity | Stops during the count | Works normally |
| Detecting differences | Late; hard to find the cause | Early; movements are still fresh |
| Best suited to | Legal or period-end requirement | Fast-moving, valuable products (class A) |
Four rules help you count without errors: freeze stock movement during the count or record movements separately; have someone who does not know the records do the count and the record keeper verify it; do not correct a difference immediately, investigate its cause first; make the correction with a document that states the reason.
In a warehouse with barcodes and addresses this work is much faster and more accurate; at warehouse scale it is treated as a separate system.
We recommend reading: What is a warehouse management system (WMS)? A guide from goods receipt to dispatch
Excel or Software for Inventory Tracking?
While product, movement and user counts are small, inventory can be tracked in Excel; when you need multiple users, multiple warehouses, barcodes or real-time work with e-commerce and accounting, you need inventory tracking software or an ERP. What decides the move is less the number of products than the cost of errors and the burden of manual transfer.
| Topic | Excel | Inventory tracking software or ERP |
|---|---|---|
| Getting started | Immediate, free | Needs setup and a learning period |
| Multiple users | Simultaneous edits collide | Simultaneous, permission-controlled |
| Movement tracking | Entered by hand, can be deleted | Tied to documents, history preserved |
| Barcode | Limited | Recording by scanning |
| Invoicing and accounting | Entered separately | Stock drops when an invoice is issued |
| E-commerce and marketplaces | Manual syncing, overselling risk | Automatic through integration |
| Alerts | None; noticed only when someone checks | Automatic alert at minimum stock |
If one of these signs applies, you have reached Excel's limit: several copies of the same file are circulating; stock on the sales channel does not match the warehouse; count differences are growing; nobody but one person knows a product's stock. For basic inventory tracking, NetKasam's free pre-accounting side brings accounts, stock, cash and invoices together. If your processes go beyond that, a custom ERP is the better fit.
We recommend reading: What is pre-accounting and what is it used for? A complete guide
What Are Common Mistakes in Inventory Tracking?
The most common mistakes are changing the stock number by hand instead of recording movements, giving every product the same attention, ignoring lead time and correcting count differences without looking at their cause.
- Changing the stock number by hand: No trace of the movement is left and the source of the difference cannot be found. Every change should be a movement tied to a document.
- Same approach for every product: Counting a steady-selling A product and a C product that sells twice a year at the same frequency is wasted effort.
- Forgetting lead time: Minimum stock only says "running low"; the reorder point answers "will it last until the goods arrive?"
- Mixing up variants: Keeping colours and sizes on one card hides which variant has run out.
- Ignoring campaigns: A reorder point calculated on normal daily sales does not work on campaign days.
- Burying count differences: If a difference is closed but its cause is not found, the same loss repeats every period.
- Keeping channels separate: When the website, marketplaces and store manage the same stock separately, overselling follows; stock should flow from a single source.
How Do You Set Up Inventory Tracking in 30 Days?
Spreading the six lessons over four weeks is the most realistic way to build a solid routine.
| Week | What to do | Output |
|---|---|---|
| Week 1 | Prepare stock cards; complete product codes and barcodes; do an opening count | Clean product list and accurate opening stock |
| Week 2 | Start recording all receipts and issues with documents; do small weekly counts | Document-backed movement records |
| Week 3 | Run the ABC analysis; calculate safety stock and reorder points for A products | Reorder points for A products |
| Week 4 | Calculate turnover; set up minimum stock alerts; do the first cycle count | Monthly stock report and a regular count calendar |
At the end of the month ask yourself: when someone asks about a product, is it a person who answers, or the record? If it is the record, inventory tracking is in place.
We recommend reading: What Is Marketplace Integration? A Guide to Managing Products, Stock and Orders in One Place
We recommend reading: How to Choose an ERP: A Guide to Process Mapping, Module Priority, Payback and Rollout
We recommend reading: What Is Shipping Integration and How Is It Done? A Guide to Shipments, Labels and Tracking for E-commerce
We recommend reading: What is procurement software? Process, approval matrix, quote scoring and three-way matching guide
We recommend reading: How to move from Excel to software: signs, cost and data migration
We recommend reading: What is shipment planning software? Routes, vehicle load and proof of delivery
Recommended reading: What Is a Barcode System and How Do You Set One Up?
Recommended reading: How to Do Production Planning
Inventory Tracking with İnovabil
At İnovabil we build inventory tracking not as a separate screen but as a system that works together with purchasing, sales, production and accounting. From stock cards and product coding to movement recording, from minimum stock alerts to ABC and turnover reports, from cycle counts to multi-warehouse structures, we turn all the lessons above into software built around your business's flow.
We connect stock to your e-commerce site, marketplaces, shipping and e-invoicing systems, and remove overselling and manual transfer. Where barcoded, address-based management is needed at warehouse scale, we support it with a warehouse management system. See what we have done on our projects page.
Tell us in a few sentences how many product lines and warehouses you work with, where you keep stock today and where you see the most differences; let us prepare an inventory tracking roadmap that fits you.
Frequently Asked Questions
How is inventory tracked, and what are the basic steps?
Inventory tracking is done by opening a single-code stock card for each product, recording all receipts and issues as document-backed movements, calculating minimum stock and the reorder point, classifying products with ABC analysis, measuring inventory turnover and verifying the records with regular counts.
How is the reorder point calculated?
The reorder point is found by multiplying average daily sales by the lead time and adding safety stock. Safety stock is the difference between peak and average daily sales multiplied by the lead time. For example, with average daily sales of 20, a peak of 26 and a 7-day lead time, the reorder point is 182 units.
What should inventory turnover be?
There is no single right value; it varies with sector and product type. It is normal for it to be very high in fresh food and low in machine spare parts. What matters is comparing your own periods and product groups: falling turnover can show tied-up capital growing, while very high turnover can show a stockout risk.
How often should a stock count be done?
A year-end count is done for legal and period-end requirements; beyond that, class A products are best counted in rotation weekly or monthly and class C products less often.
Can a small business track inventory in Excel?
Yes, if product and movement counts are low, there is one user and the sales channels are limited. But when you need several users, multiple warehouses, barcodes, e-commerce and accounting integration, Excel produces errors and lost time. When several copies of the same file start circulating, it is time to move to inventory tracking software.